Data Download
As part of our ongoing improvement, we are asking users to please provide some basic information to help us understand how this data is useful. Your information will not be shared with any third party and will be used exclusively to improve the Atlas.
Upon completing the following form, users will be sent to a data repository with access to download the behind-the-scenes comma-separated values (CSV) tables which support the visualization of maps and tables on the website. The CSV tables are broken down as described in the Data Overview section.
For academic and reporting references, please use the following citation for the Bay Area Energy Atlas data:
California Center for Sustainable Communities (2026). Bay Area Energy Atlas. figshare. Collection. https://doi.org/10.6084/m9.figshare.31807846
Please be aware that these datasets can and will be updated over time as data or technology improvements allow. Updates will be noted when they occur. Please read the Methods page and Limitations section to better understand how this data can be used and areas of embedded error.
Disclaimer: Validation of data is an ongoing process and we cannot guarantee data accuracy. We welcome and appreciate feedback on data irregularities to help us improve our database. All current data on the site should be viewed and used with this understanding.
Data Overview
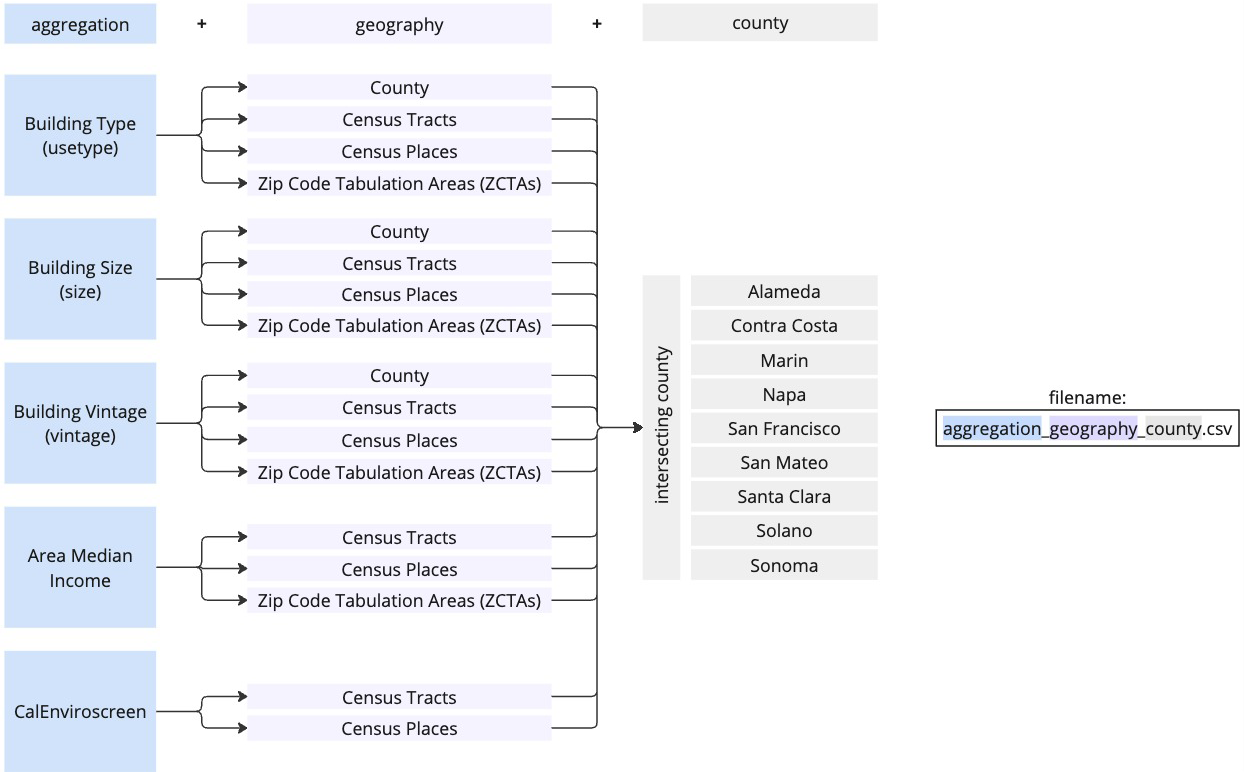
To best accommodate expected use cases, the data are available for download in two ways: (1) By aggregations as reflected in the atlas pages for all available geographies and (2) Organized by aggregations as reflected in the atlas pages, then by geographic level, and finally by county (see figure below). While Census Tracts fit neatly within county boundaries, Census Places and Zip Code Tabulation Areas in Option (2) are included in the county for which they are entirely or primarily contained.
Each file contains roughly the same field structure, which is described in the table below:
| Column Name | Column Description | Column Unit |
|---|---|---|
| GEOID | Census Bureau Geographic Identifier | NA |
| display name | Formatted name of the selected geography | NA |
| usetype | Building use type category | NA |
| secondary category | When applicable, this will show the available bins for building vintage, building size, and Area Median Income | Vintage year, square feet, or percent of area median income |
| year | Year of consumption | Year |
| month | Month of consumption | Month |
| pop | Total population | People |
| median_household_income | Median household income per the 2018-2022 ACS 5-Year Estimates | USD |
| FY 2022 Income Limit Area | Relevant area as determined by HUD to identify Median Family Income for the area median income calculation. Only available in the area median income datasets. | NA |
| limit_area_median_income | Median Family Income as determined by HUD per the relevant income limit area. Only available in the area median income datasets. | USD |
| sqft | Total square footage of relevant geography and use type | Square Feet |
| btu | Total combined consumption in BTUs | BTU |
| btu_median | Median combined consumption in BTUs | BTU |
| btu_per_sqft_median | Median per square foot combined consumption in BTUs | BTU/sqft |
| btu_percap* | Per capita combined consumption in BTUs | BTU/population |
| kwh | Total electricity consumption in kWh | kWh |
| kwh_median | Median electricity consumption in kWh | kWh |
| kwh_per_sqft_median | Median electricity consumption per square foot in kWh | kWh/sqft |
| kwh_percap* | Per Capita electricity consumption in kWh | kWh/population |
| therm | Total natural gas consumption in therms | Therms |
| therm_median | Median natural gas consumption in therms | Therms |
| therm_per_sqft_median | Median per square foot natural gas consumption in therms | Therms/sqft |
| therm_percap* | Per capita natural gas consumption in therms | Therms/population |
*Keep in mind that while per capita consumption is available for all building use types, it may not be appropriate for non residential use type categories.
Masked Data
You will notice that some of the cell values have values of -999,999,999. That is an indication that the data is masked due to privacy rules (See Methods and FAQ for more information). Additionally, data are excluded from the sets when either the raw data is not available or, in the case of derived values, the source is not available (ie. cannot calculate median consumption per square-foot if square-footage information is missing).
If you have any questions about the data, feel free to contact us at ccsc@ioes.ucla.edu.